20.5 Debugging an IEC 61499 application
After a project has been built and binded to an existing Excel configuration, a user would normally want to check if every part is working according to the prior requirements before compiling finished project and uploading it to production. Both 4Diac framework and WCC Lite offer tools for flexible debugging.
There is a possibility that 4Diac FORTE might not start as a process. It may happen if multiple faults occured and process has stopped. Process is also programmed to not start if no excel configuration file is found, therefore a user should make sure that Excel configuration is uploaded and ready for use.
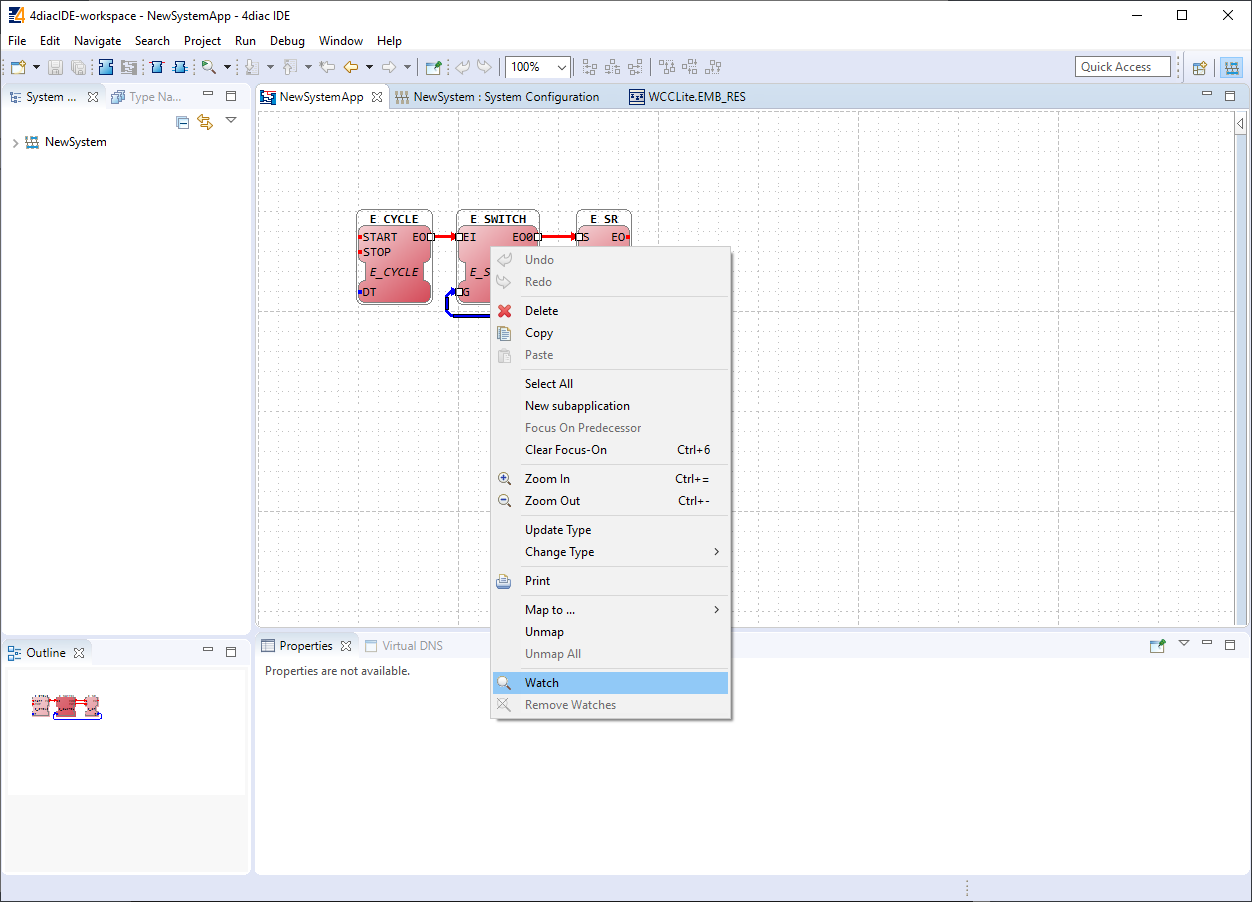
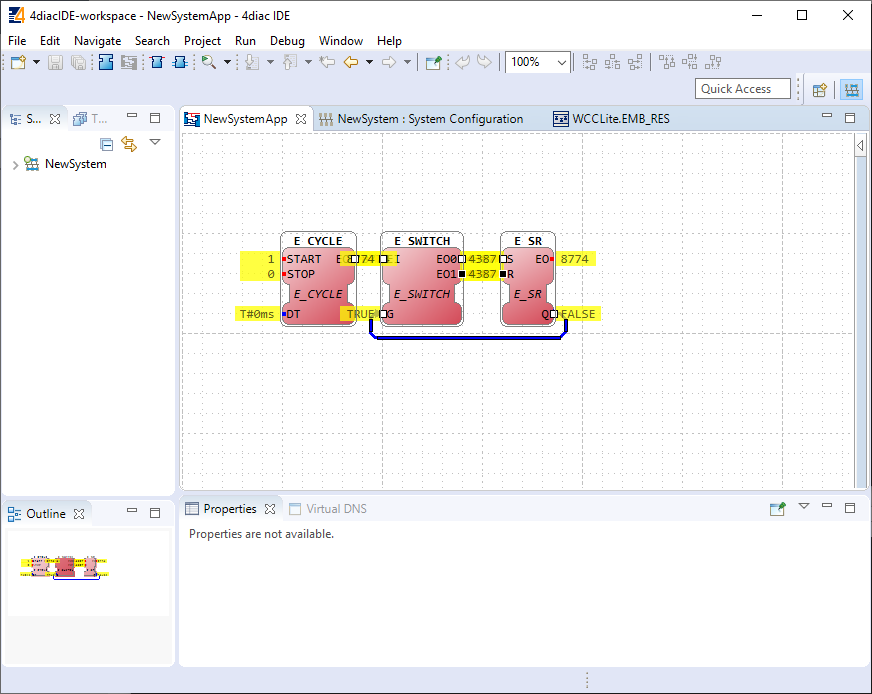
Individual function blocks can be set to Watch mode: events can be triggered and values can be forced at inputs or outputs (look into images bellow). To monitor the function blocks, the application should be deployed and the IDE should be in Online mode (Debug -> Monitor System -> NewSystem).
Selecting watch mode:
Function blocks in watch mode:
Seeing information dynamically updated on 4Diac IDE might be very informative, however, some applications might require accesing WCC Lite via command-line interface. For example, in case of information not being updated one would want to assure that 4Diac FORTE in WCC Lite is not filtering data out but sending it to internal database (Redis). To run 4Diac FORTE debug from command-line interface, a user should write forte and press Enter. All possible choices are shown by adding -h flag. More flags are shown in a Table bellow. Make sure to stop any running process that could use the address that 4Diac framework is going to use.
Table. 4Diac FORTE command line debugging options:
-h - Display help information
-c <IP>:<port> - Set the listening IP and port for the incoming connections
-r - Show redis messages
-d <debug level> - Set debugging level
-f - Set the boot-file where to read from to load the applications

