Status
Overview
System
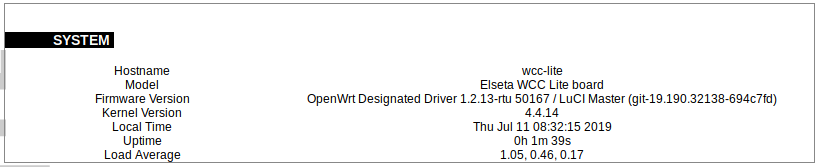 System section in status tab shows basic information about current status of the system.
Hostname: The label that is used to identify the device in the network.
Model: Model of the device.
Firmware version: Current firmware version.
Kernel version: Current kernel version.
Local Time: Current local time.
Uptime: The time a device has been working.
Load average: Measure CPU utilization of the last 1, 5, and 15 minute periods. Load of 0.5 means the CPU has been 50% utilized over the last period. Values over 1.0 mean the system was overloaded.
Memory
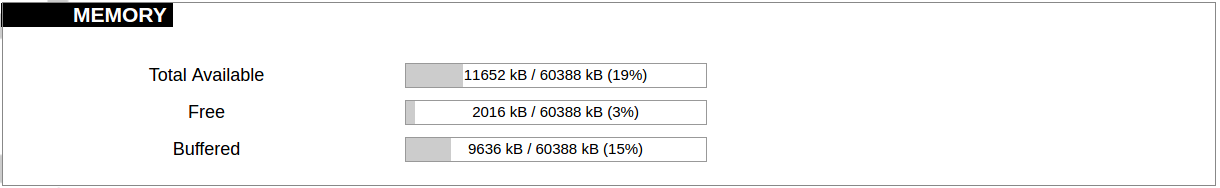
The ”Memory” window provides memory usage information on the device.
Total available memory: The amount of available memory that could be used over installed physical memory.
Free: The amount of physical memory that is not currently in use over installed physical memory.
Buffered: The amount of buffered memory that is currently in use for active I/O operations over installed physical memory.
Network
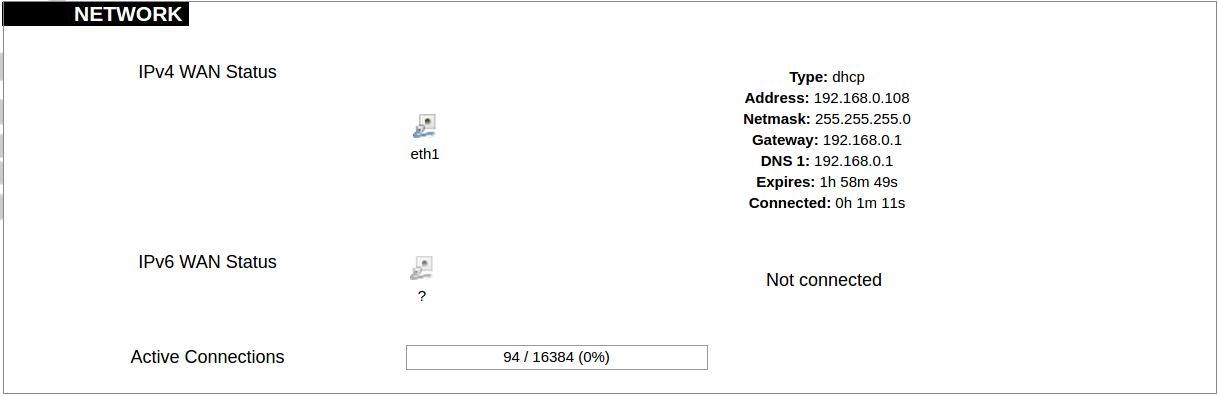
IPv4 WAN, IPv6 WAN status and active connections of the device.
Type: Type of addressing of IPv4 network interface – DHCP or static.
Address: IP address of the device.
Netmask: Netmask of the device.
Gateway: IP address of the Gateway.
DNS: IP address of DNS server.
Expires: DHCP lease expiration time of the connection.
Connected: The time a device has been connected.
Active Connections: The number of the active connections with the device.
DHCP leases
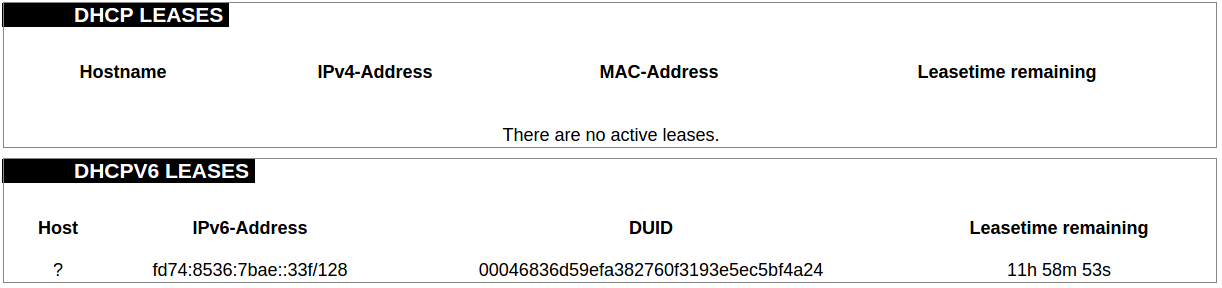
DHCPv4 and DHCPv6 lease expiration time.
Hostname: The label that is used to identify the device in the network.
IPv4-Address: IPv4 address of network interface.
MAC-Address: The media access control address of IPv4 network interface.
DUID: DHCP Unique Identifier of IPv6 network interface.
Lease Time remaining: The amount of time the device will be allowed connection to the Router.
Wireless
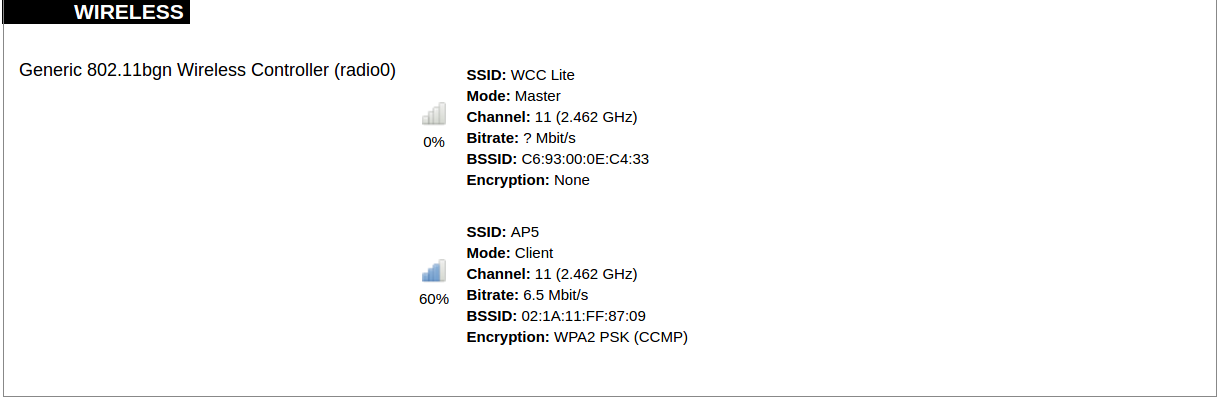
WiFi interface information window.
SSID: The sequence of characters that uniquely names a wireless local area network.
Mode: Shows how the device is connected to the wireless network – Master or Client.
Channel: The number of channel and radio frequency for connection to access point.
Bitrate: The number of bits that pass the device in a given amount of time.
BSSID: The MAC address of the wireless access point.
Encryption: Security protocol for the wireless network.
Associated stations
 List of associated stations (clients).
Network: Mode and SSID of network point.
MAC-Address: The media access control address of IPv4 network interface.
Hostname: The label or IP address that is used to identify the device in the network.
Signal/Noise: Received signal level over the background noise level. -30 dBm is the maximum achievable signal strength, -70 dBm is the minimum signal strength for reliable packet delivery in the wireless network.
RX Rate/TX rate: Used measure data transmission in the wireless network over bandwidth. RX Rate represents the rate at which data packets being received by the device, TX Rate represents the rate at which data packets being sent from the device.
Board information
 Board information provides the following details:
Hardware version: Current hardware version;
Serial number: Serial number of the board;
SoC ID: Unique identifier of CPU unit;
Firewall
IPv4 Firewall
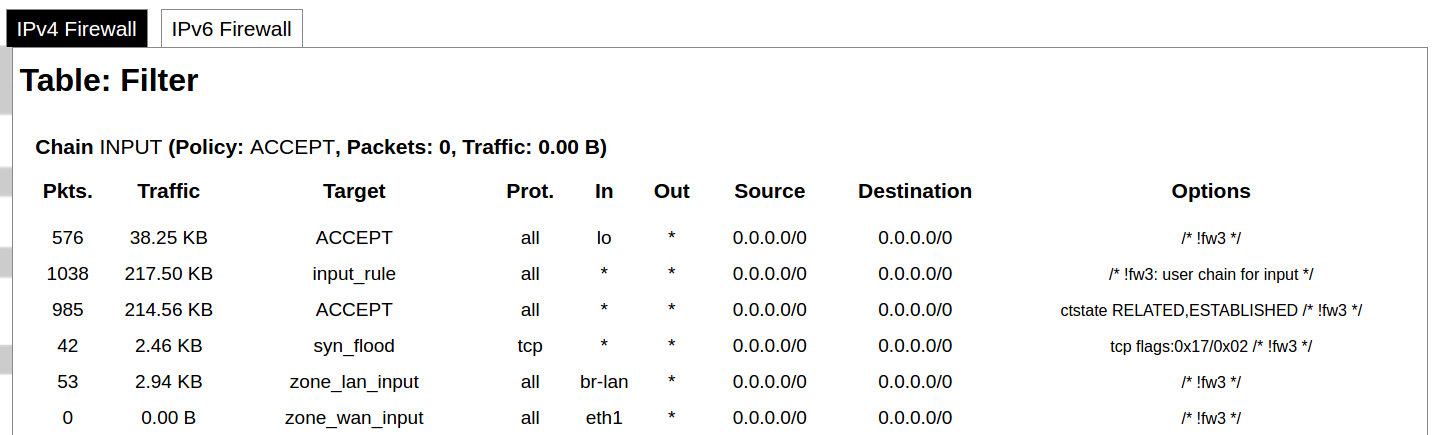
Firewall rule list for IPv4 traffic.
Table: The four distinct tables which store rules regulating operations on the packet. Filter concerns filtering rules. NAT concerns translation of source or destination addresses and ports of packages. Mangle table is for specialized packet alteration. The raw table is for configuration exceptions.
Chain: The list of rules. Filter table has the following built-in chains: Input – concerns packets whose destination is the firewall itself, Forward – concerns packets transiting through the firewall, Output – concerns packets emitted by the firewall, Reject – reject the packet, Accept – allow the packet to go on its way. NAT table has the following built-in chains: Prerouting – to modify packets as soon as they arrive, Postrouting – to modify packets when they are ready to go on their way. Mangle table has one built-in chain: Forward for transiting packets through the firewall.
Pkts.: The packets processed by the firewall.
Traffic: The amount of data processed by the firewall.
Target: The chain of the table of the firewall.
Prot.: The transport layer protocol processed by the firewall.
In: The network interface for the input chain processed by the firewall.
Out: The network interface for the output chain processed by the firewall.
Source: IPv4 address of the device that the packet comes from.
Destination: IPv4 address of the device that the packet goes to.
Options: The options for configuring the firewall.
IPv6 Firewall
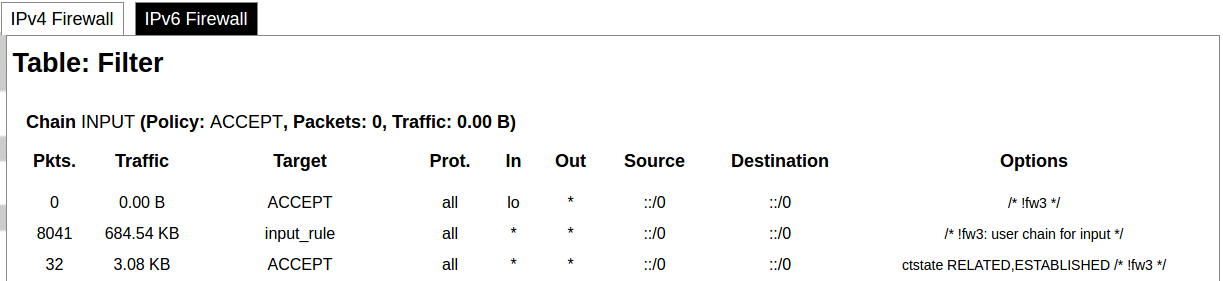
Firewall rule list for IPv6 traffic.
Table: The three distinct tables which store rules regulating operations on the packet. Filter concerns filtering rules. Mangle table is for specialized packet alteration. The raw table is for configuration exceptions.
Chain: The list of rules. Filter table has the following built-in chains: Input – concerns packets whose destination is the firewall itself, Forward – concerns packets transiting through the firewall, Output – concerns packets emitted by the firewall, Reject – reject the packet, Accept – allow the packet to go on its way. Mangle table has one built-in chain: Forward for transiting packets through the firewall.
Pkts.: The packets processed by the firewall.
Traffic: The amount of data processed by the firewall.
Target: The chain of the table of the firewall.
Prot.: The transport layer protocol processed by the firewall.
In: The network interface for the input chain processed by the firewall.
Out: The network interface for the output chain processed by the firewall.
Source: IPv6 address of the device that the packet comes from.
Destination: IPv6 address of the device that the packet goes to.
Options: The options for configuring the firewall.
Routes
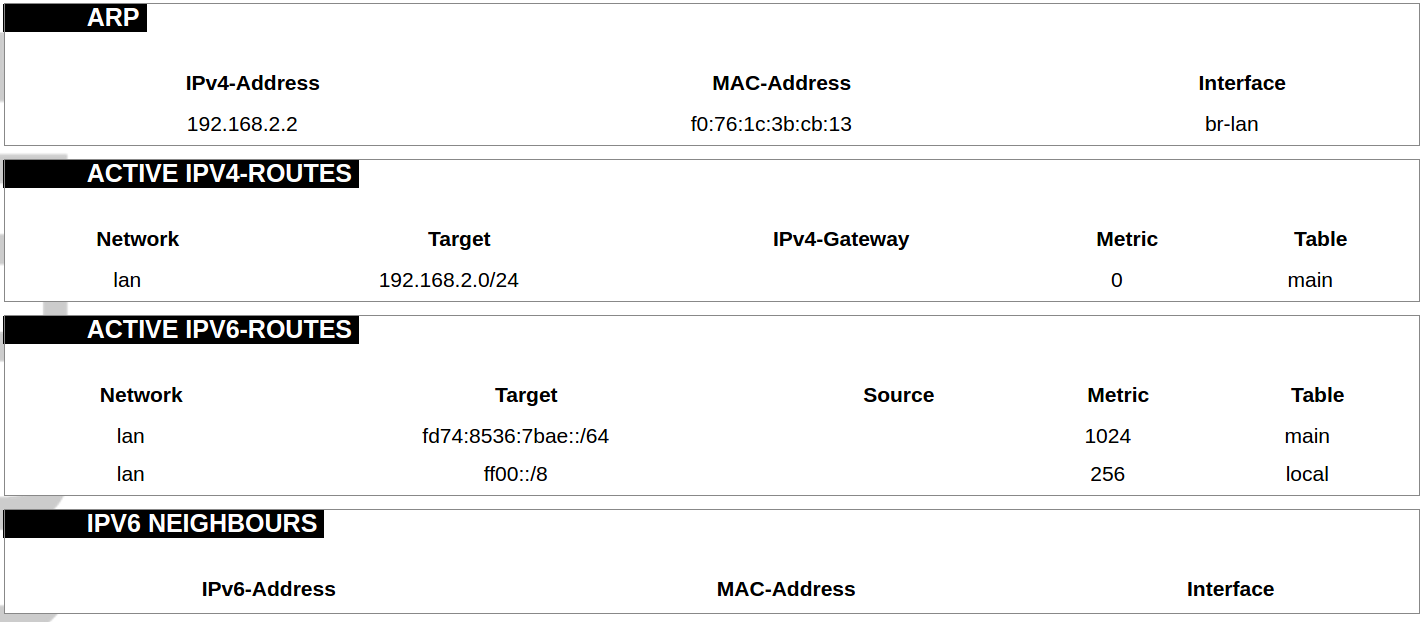
The routing tables provide information on how datagrams are sent to their destinations.
ARP: An address Resolution Protocol which defines how IP address is converted to a physical hardware address needed to deliver packets to the devices.
Interface: The type of Network interface. br-lan refers to the virtual bridged interface: to make multiple network interfaces act as if they were one network interface.
Network: The type of network through which the traffic will be sent to the destination subnet.
Target: An address of the destination network. The prefix /24 refers the subnet mask 255.255.255.0.
IPv4-Gateway: IP address of the gateway to which traffic intended for the destination subnet will be sent.
Metric: The number of hops required to reach destinations via the gateway.
Table: The type of routing tables: main (default), local (maintained by the kernel).
IPv6 Neighbours: The devices on the same network with IPv6 addresses.
System Log
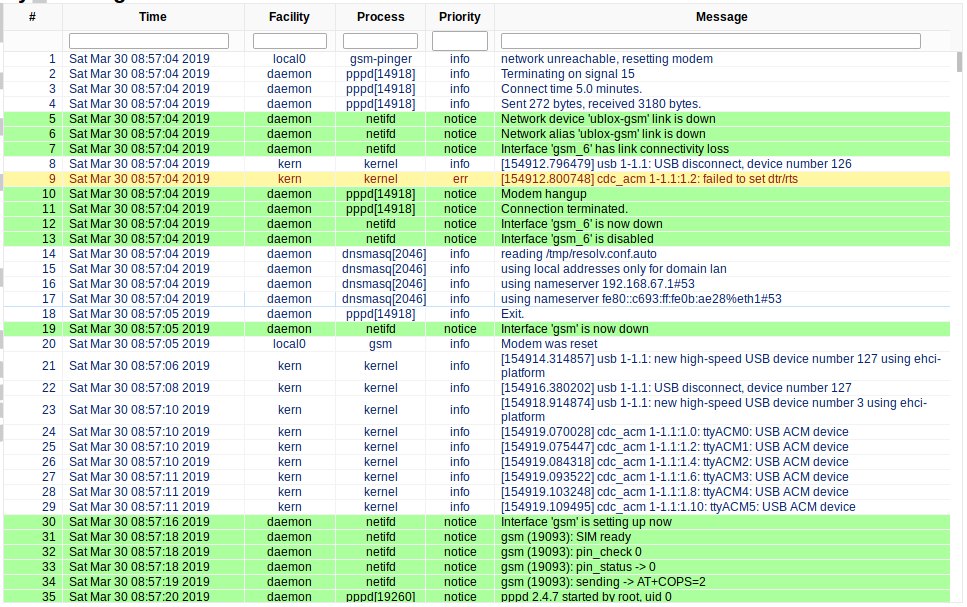
System log window shows a table containing the events that are logged by the device. It has the following columns:
- # (sequence number);
- Time (day of the week, month, day of the month, time and year);
- facility;
- process (who generated the message);
- priority level;
- message.
Messages can be sorted and filtered to extract a particular set of messages. This might be useful when debugging kernel or protocol level problems.
Kernel Log
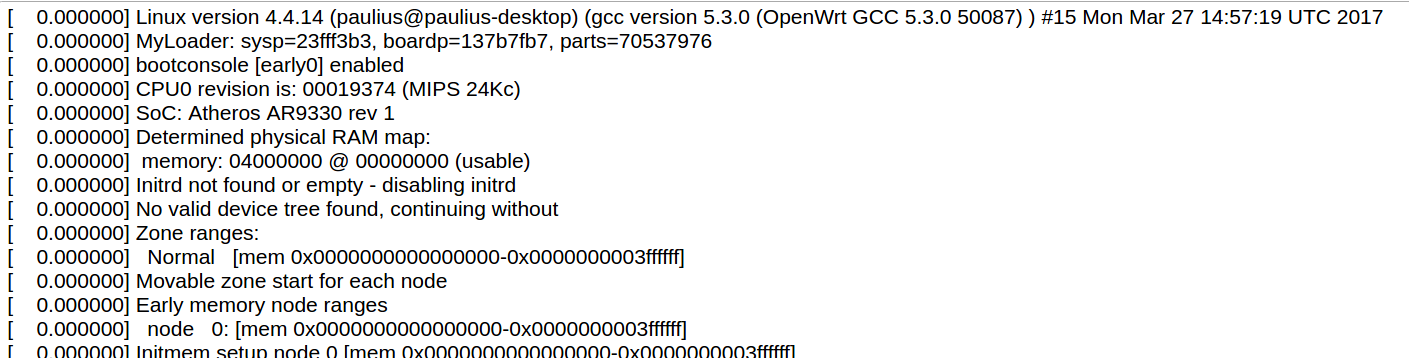
Kernel log shows a list of the events that are logged by the kernel of the device. Log format: time in seconds since the kernel started and message.
Processes
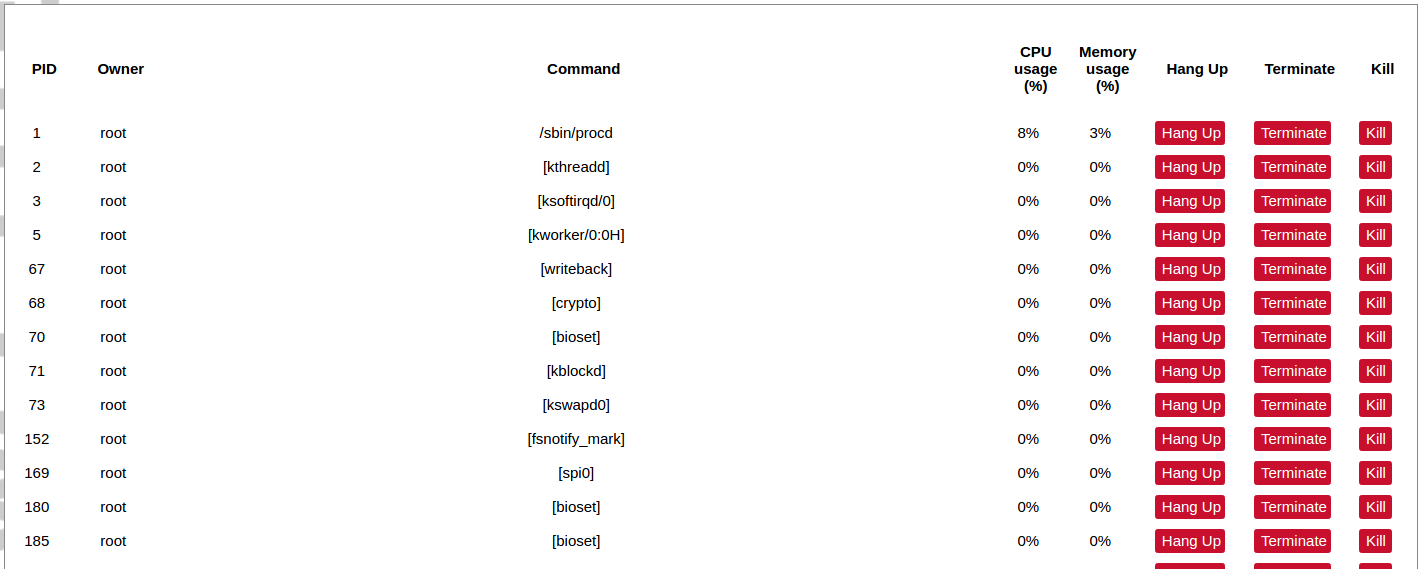
List of processes running on the system.
PID: Process ID.
Owner: User to whom the process belongs.
Command: Process.
CPU usage: It is CPU usage of the individual process. CPU usage above 90 % is an indicator of insufficient processing power.
Memory usage: Memory usage of the individual process.
Hang Up: To freeze the process.
Terminate: To end the process cleanly.
Kill: To end the process immediately.
Realtime graph
Realtime Load
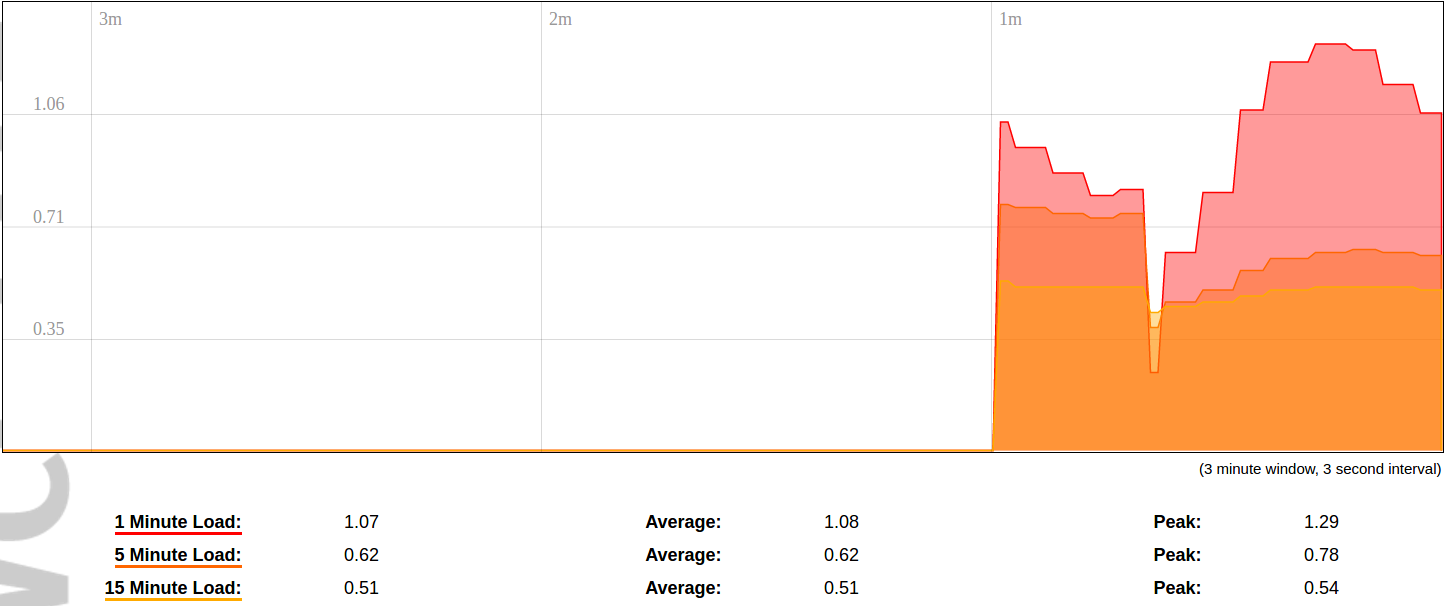
CPU utilization graph. Load of 0.5 means the CPU has been 50% utilized over the last period. Values over 1.0 mean the system was overloaded.
Realtime Traffic
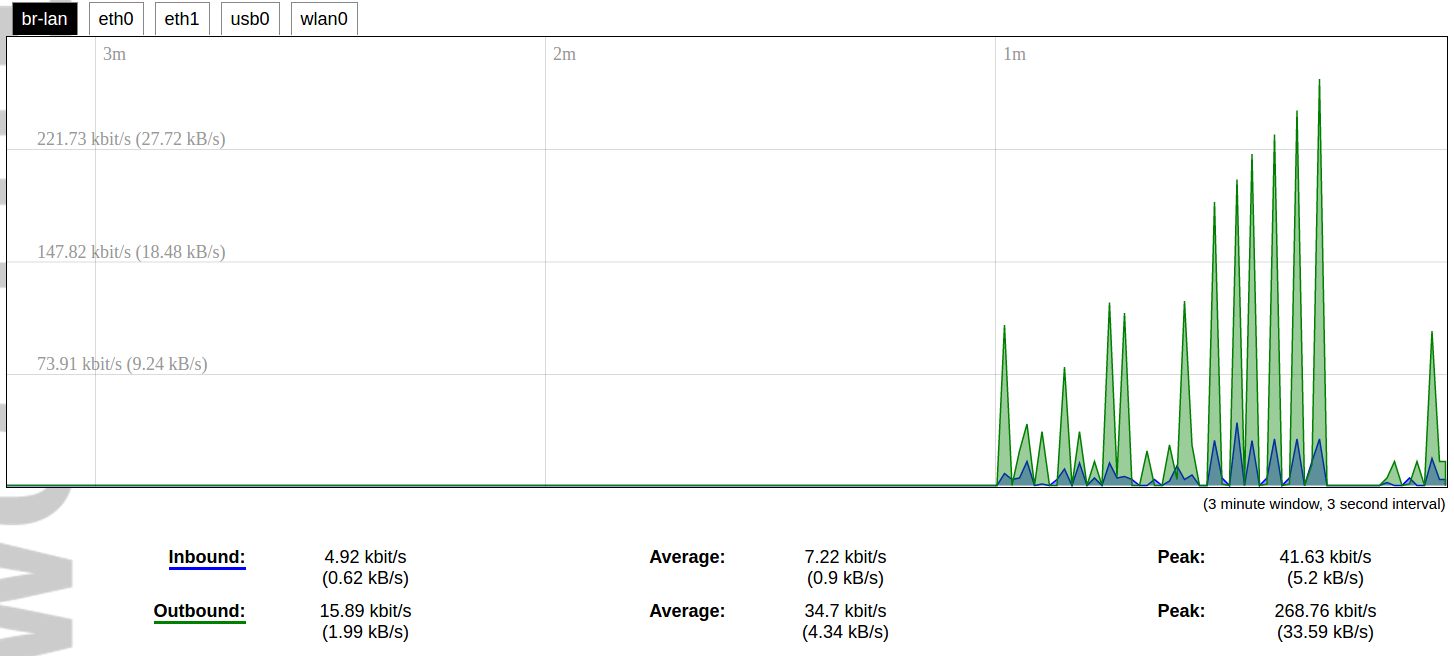
Graphs representing the status of the virtual and physical network interfaces of the device.
Inbound: The speed at which the incoming packets arrive at the device.
Outbound: The speed of the packets which were originated by the device.
Phy. Rate: The speed at which bits can be transmitted over the physical layer.
Realtime Wireless

WiFi status graph.
Signal: Signal strength level.
Noise: Noise level.
Phy. Rate: The speed at which bits can be transmitted on the physical layer.
Active connections
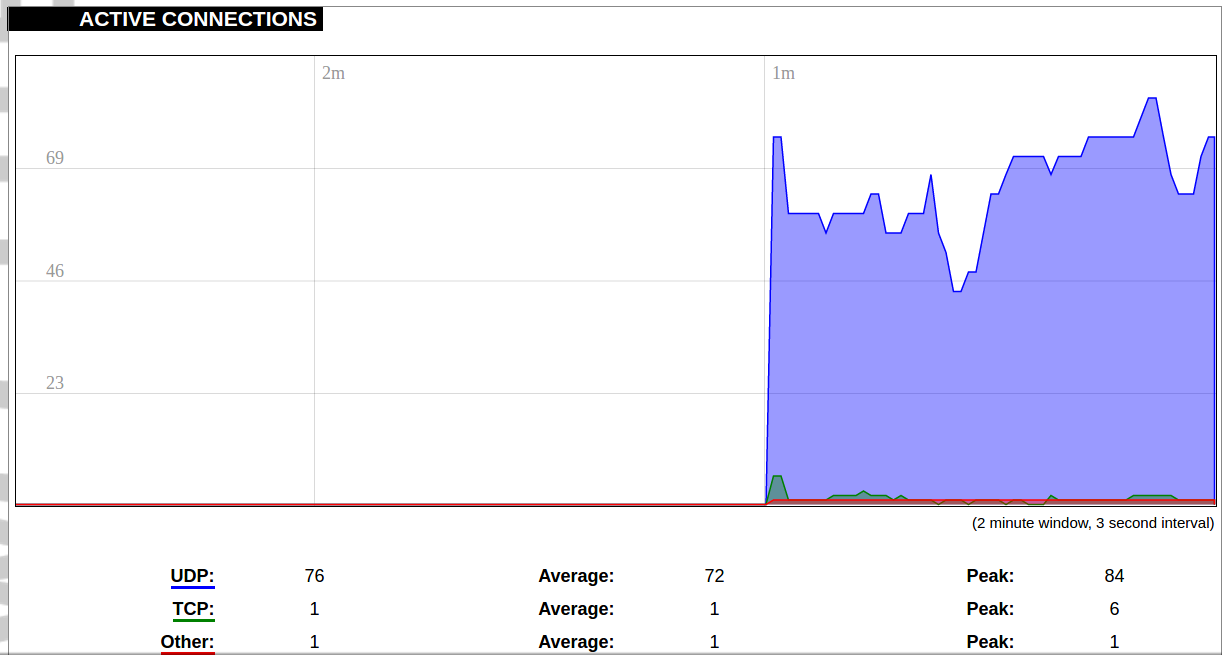
Graph representation of active connections with the device.
UDP: Transport layer – User Datagram Protocol.
TCP: Transport layer – Transmission Control Protocol.
Network: Type of the network layer – IPv4 or IPv6.
Source, Destination: IP address and the port number.
Transfer: The amount of the transferred data in kB and packets.
GSM signal quality

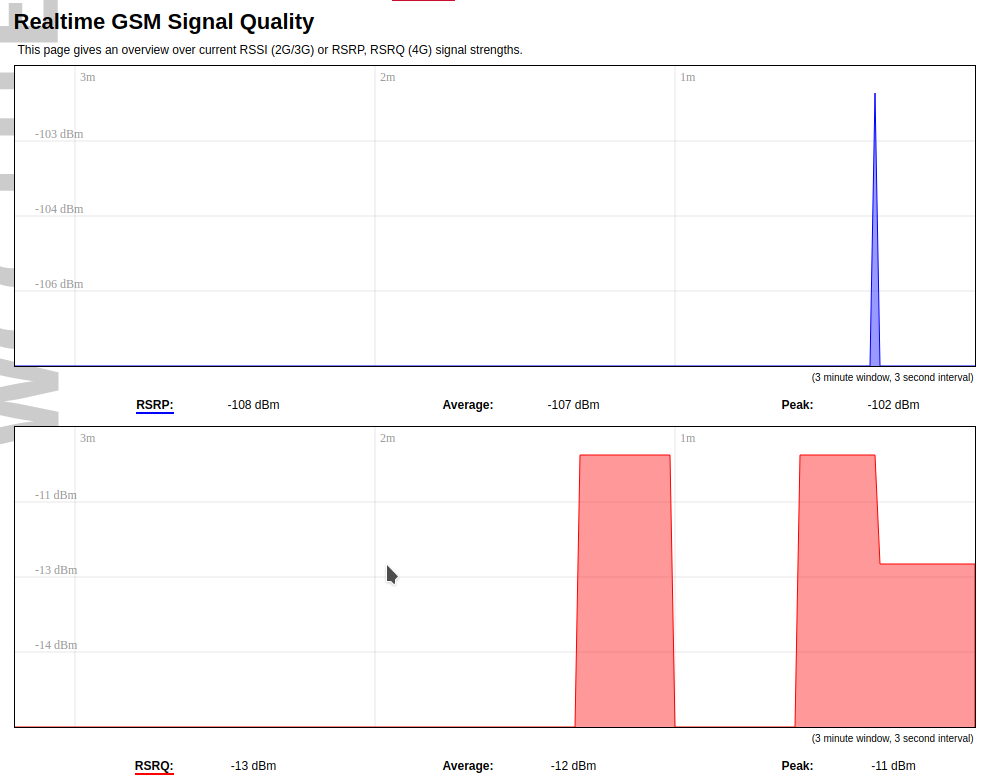
Graph representation of gsm modem receiving signal quality. RSRP - RSRQ graph is showed, when connected to 4G/LTE network, RSSI - when 2G/3G networks are used.
RSSI: Received Signal Strength Indicator in dBm.
RSRP: Received Signal Reference Power in dBm.
RSRQ: Received Signal Reference Quality in dBm.
GSM status
This page shows all information that is related to GSM modem.
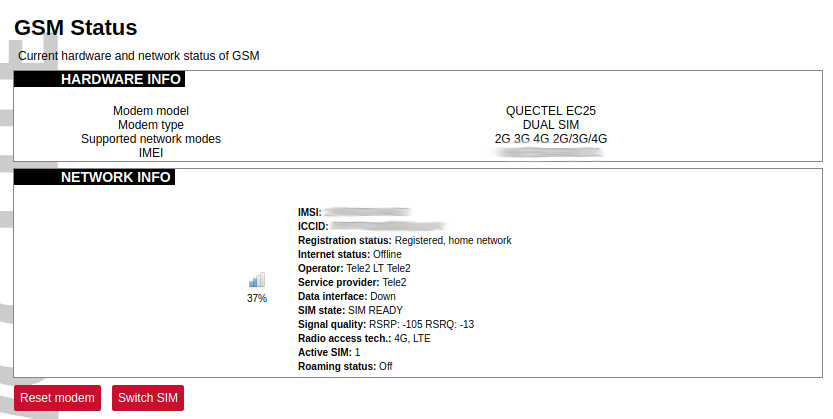
Hardware info
All static information on GSM modem.
Modem model: Manufacturer and model of present modem.
Modem type: Single SIM or Double SIM modem.
Supported network modes: Shows which network modes (or their combinations) are supported (e.g. 2G 4G 2G/4G).
IMEI: IMEI (International Mobile Equipment Identity number).
Network info
All dynamic information on GSM modem and connected network.
IMSI: IMSI (International Mobile Subscriber Identity) number related to current SIM card user.
ICCID: ICCID (Integrated Circuit Card Identifier) number related to physical SIM card.
Registration status: Curren status of network connection.
Internet status: Status of connection to internet ( valid, when gsm-pinger is enabled and can reach provided hosts).
Operator: Operator’s name, to which modem is currently connected.
Service provider: IMEI (Service provider for SIM card. Data interface: Shows, whether wcc-lite have a data connection through gsm or not (possible values: ”Up”, ”Down”).
SIM state: Shows current status of SIM card (needs PIN, needs PUK, not-inserted and etc.).
Signal quality: Shows current signal strength value in dBms. RSSI value is shown, when connected to 2G/3G networks, RSRP-RSRQ values - when connected to 4G network.
Radio access tech.: Current radio technology used (2G, 3G or 4G).
Active SIM: Shows which SIM card is active (if the modem is Dual SIM).
Roaming status: Current status of roaming (”Off”, ”On”).
Little bars with percentage at the center left shows signal strength. It is calculated with the respect to current radio access technology used (RSSI or RSRP). Two buttons at the bottom can reset (cold-reset) modem or manually switch SIM cards (if it is Dual SIM modem and both cards are enabled).

Signal quality is described in different ways for different type for different mobile services: Received Signal Strength Indication (RSSI) in GSM (2G) and UMTS (3G), the Reference Signal Received Quality (RSRQ) in LTE RAT.
The Reference Signal Received Power (RSRP) is a LTE specific measure that averages the power received on the subcarriers carrying the reference signal. The RSRP measurement bandwidth is equivalent to a single LTE subcarrier: its value is therefore much lower than the total received power usually referred to as RSSI. In LTE the RSSI depends on the currently allocated bandwidth, which is not pre-determined. Therefore the RSSI is not useful to describe the signal level in the cell.
VNSTAT Traffic monitor
To monitor the traffic of various network interfaces VNSTAT Traffic monitor can be used. Traffic tracking can be useful if user wants to have a precise information on how much data is used because it can have a dependance with data transmission costs, for example, mobile (cellular) data.
Graph

An example graph shows the statistics gathered for two network interfaces. In these graphs:
eth1: Network interface (e.g. Ethernet).
br-lan: Virtual network interface (bridge).
rx: Data packets received by the device.
tx: Data packets sent from the device.
Configuration
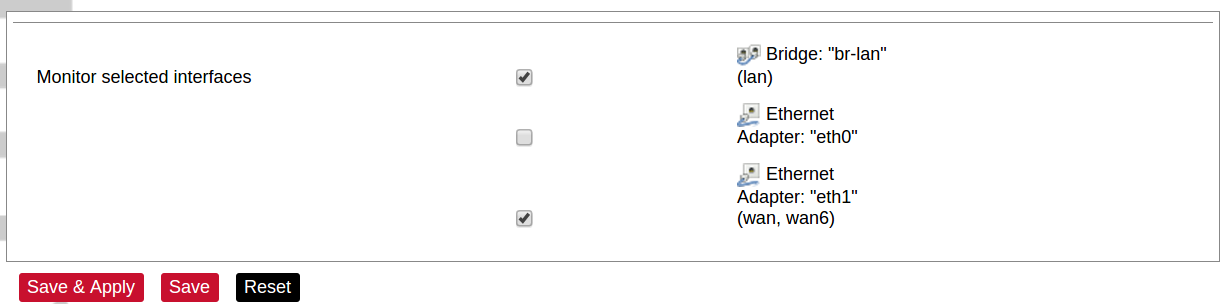
Interfaces to be monitored can be selected in a configuration screen. It includes all the network interfaces configured in a system. To start or stop monitoring user should either select or unselect respective checkbox and save settings by pressing Save & Apply.